Hello. My name is Pini Dibask, and I'm a Product Manager for Database Performance Monitoring with Quest. In today's video, we'll review Foglight for SQL Server and show you how it is best suited to monitor your SQL Server instances. Foglight for SQL Server is a 24x7 enterprise monitoring solution which allows you to effectively monitor your databases, featuring deep resource monitoring capabilities with powerful analysis toolset to enable fast problem resolution and proactively fix issues before they become a real problem.
This solution also provides a rich set out-of-the-box in-context and enterprise reports. With a low overhead agentless architecture, Foglight for SQL Server monitors your SQL Server environments for both physical and virtual deployments. This solution supports all SQL Server editions and configurations, including on-premise as well as cloud deployments.
Let's start with the monitoring aspect of the product. Foglight for SQL Server is part of Foglight for Databases' heterogeneous solution, which allows you to monitor your entire environment across domains from a single view. This solution supports monitoring traditional relational databases-- such as Oracle, SQL Server, DB2, SAP ASE-- open source relational databases-- such as Postgres, MySQL-- and also NoSQL databases-- such as the MongoDB and Cassandra.
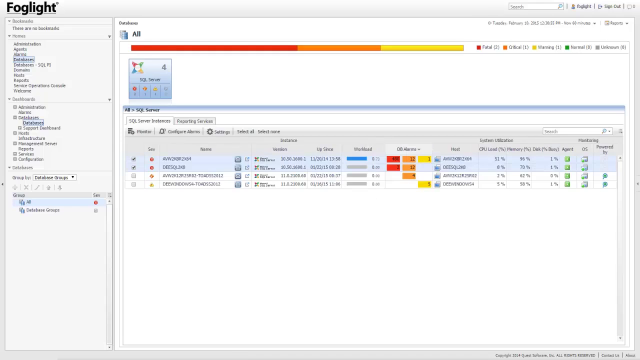
It also supports databases which reside in the cloud so it can cover both on-premise and cloud deployments. Here, we can see the Foglight Global View, which is the first screen that you can see, once you log into the product. The Global View page provides high level monitoring information for your entire cross-platform database environment and can address specific common DBA questions such as, which instances have the highest workload?
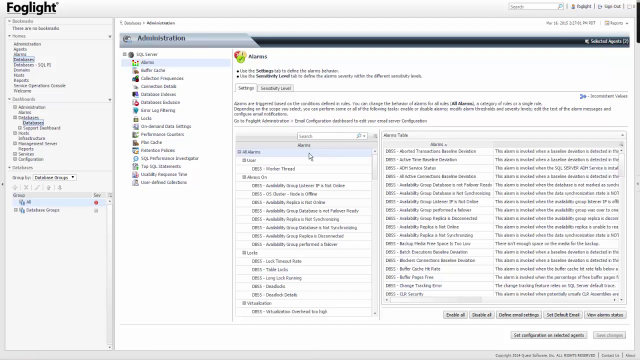
Which instances haven't been upgraded to the latest release? Which instances have been available for the longest duration? Foglight for Databases provides dozens of comprehensive out-of-the-box alarms, dashboards, and reports, which you could access directly from the Global View page.
When analyzing a potential problem, it is crucial to understand whether the observed behavior is normal for that environment. Foglight for SQL Server's smart baseline algorithm understands your environmental profile and maps the expected behavior in different time periods-- hour in a day, day in a week, week in a month, and so on.
In this example, you can see whether your host resources utilization is within the expected baseline range or deviated from the baseline. This allows you to spot rule changes in the normal activity and avoid wasting time in looking for the problems. Additionally, you can easily understand whether your instance workload is within the expected profile.
Foglight for SQL Server has rich monitoring coverage, covering high availability architectures and disaster recovery solutions, monitoring different storage aspects, up to date with the recent technologies including SQL Server-only nooks, providing both real-time and historical views.
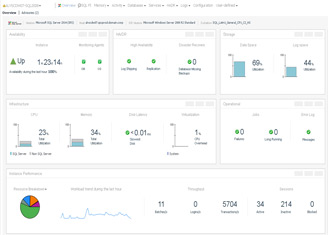
The SQL Server Overview dashboard is the starting point for getting to the root cause of the issue, as it covers all aspects of the instance health at a glance, showing availability of the instance databases and underlying related services, status summary of high availability and disaster recovery solutions, highlight storage utilization metrics, uncovers any OS resource bottlenecks including virtualization issues, detecting operational failures including job failures and error log messages. It also provides performance insights into resource consumption, workflow trend, throughput and sessions activity.
Here is an example of how the Overview dashboard clearly identifies storage issues, as 94% of the data space is already consumed. And also, data protection issues as five databases don't have any backups. In the right section of the Overview dashboard, you can view a list of alarms as well as top 10 SQL statements ordered by the active time. The blocking Lock dashboard allows to analyze the current lock trees and easily identify how many sessions are blocked, what is the leading blocking session, and which SQL statement is executed by that session.
Foglight for SQL Server is also capable of showing detailed historical analysis for deadlock information in order to solve even the most complicated blocking lock situations. For example, you can analyze deadlock by applications. You can also examine the details of each session participating in the deadlock, and also view the entire deadlock graph.
Lack of space where your critical file groups and logs reside could lead to stability issues and even downtime. The Databases dashboard allows you to quickly identify and respond to storage shortage situations as well as investigate user trends to better prepare for tomorrow's needs. The TempDB dashboards provide overall view of this critical database resource usage and, short-term, the time it takes to resolve space-related problems, showing detailed usage profile information over time, real-time and historical version store usage statistics, as well as current and historical sessions which consume TempDB resources.
Memory has always been a critical key resource to instance performance. With SQL Server, in memory OTP feature, ensuring the memory is utilized properly is even more important. The Memory dashboard provides a wide overview of the memory usage and shows how stressed SQL Server is for memory utilization standpoint.
In this case, SQL Server uses only 89% of the memory it needs, and there is a lot of available memory in the machines, so there is no memory pressure. We can further analyze the heavy memory consumers starting from the most utilized resource pool all the way to the object level in the Databases dashboard. In this case, we selected a specific database and we can see in the table below that this database has two tables. And for each one of those tables, we can see the number of rows, we can see the reserved memory size, as well as they used the memory size.
Foglight for SQL Server also monitors your replication environments. A dedicated overview dashboard shows both the application environment topology and its status. Topology view includes a full list of servers and databases on both publisher and subscriber sites. Status indication clearly points to the areas that needs attention. So you can easily zoom in and analyze any problem that was found during the replication process.
High availability solutions are common in production environments. Foglight for SQL servers a false all high availability configurations, including failover clusters, log shipping, mirroring, and always-on availability groups. With the Always-On dashboard, you get complete overview of the environment and status, including the topology of all the availability replicas and databases, as well as their status.
So far, we've reviewed the monitoring aspect of the product. We are now going to focus on the most powerful analysis toolset in the market, the SQL Service Performance Investigator. A multi-dimensional historical analysis of your instance workload allows a deep-dive investigation of a single dimension or a combination of dimensions. SQL Server PI is capable of analyzing multiple dimensions out of the box.
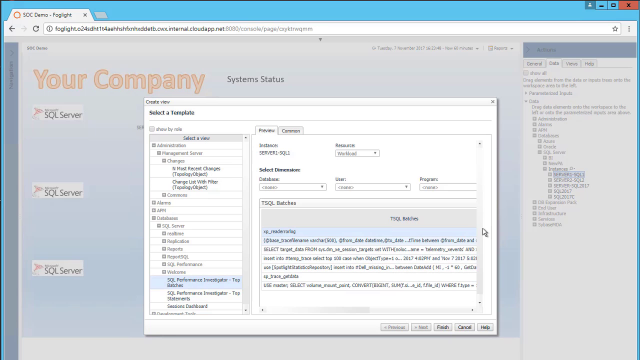
Here, we can see all the SQL batches executed on databases by user SA, as well as the associated statistics with each dimension, and also the associated wait events. The sessions dimension allows you to review the activity of each session uniquely identified by the SPID and login time. You can further drill down to any dimension, such as SQL statements, to review those that were executed by the selected session.
The Locked Objects dimension allows you to start a lock analysis investigation by first examining the locked objects themselves in order to easily identify the root cause for the locks in the system. Clicking on the object that is associated with the highest lock duration reveals the lock duration and the details of each session that was blocking it.
The blocking history tab will allow you to view all the lock trees associated with any dimension drill-down combination-- allows you to understand what was the lead blocker session and how many sessions were affected? To analyze I/O-based activity, SQL PI provides a rich set of tools to help identify the root cause of an I/O contention. In this case, we chose a specific object and we drilled down to view all the SQL statements that accessed that object.
And we can see two of the ML operations which were associated to I/O activity on that object. We can always see the associated statistics-- in this case, the I/O-related statistics-- for the selected dimension. Once we identify the problematic SQL statement, we can easily analyze its execution plan by clicking on the Analyze Plan button. We will show how to do so in a minute.
You could easily also investigate files and disks I/O activity by clicking on those dedicated dimensions. For example, let's say if we chose the Files dimension. We can see the top data files in database. To tune a SQL statement, the best place to start is by understanding its execution plan. The Execution Plan Analysis dashboard allows you to analyze and compare historical execution plans for both statements and batches.
To start, you could easily focus on the heaviest statement within a batch. Analyze the entire plan flow using the Plan Details tab, review all operations, or focus on the related objects accessed in the plan. You can now focus on any object and retrieve more information about its structure, size, and indexes.
Click on Compare Plans to compare different execution plans. The execution plan comparison highlights the changes between execution plans, whether the cost or operation changes. The change tracking is a powerful and unique feature, which allows you to track different changes and visually correlate those changes with the actual workload activity at the same time in order to find those changes that affected the environment the most.
At the right pane, we can see different change categories. In this case, we found that during the time period selected, database file, and log file group, your index has been created. Your execution plan has been found for a SQL statement. New account has been added. Now I would like to show you the Compare tool.
SQL PI Compare tool is a powerful feature for analyzing performance and configuration changes. It can compare performance of a specific dimension in two different time frames. This can be useful when trying to analyze the impact of a recent application upgrade or hardware change. It can compare performance of different dimensions such as user sales to user HR, one SQL statement to another.
It also allows you to compare the instance workload to the expected baseline as well as comparing two different instances, such as comparing between production instance and the test instance, or development instance. This could be extremely useful, especially for DevOps teams. Here, you can see how easy it is to compare performance statistics of two separate instances. By clicking on the Configuration tab, you could also compare the configuration parameters of two instances. If you would rather focus only on the parameters which are different, simply click on the Unequal button.
We've covered the basic and the advanced monitoring capabilities of the product. Now I would like to talk about reports. Foglight for SQL Server also provides rich out-of-the-box performance reports that can be shared with other stakeholders in the organization. These reports can be run on-demand or scheduled to run periodically. It's also possible to create custom reports based on the rich set of collected information.
You could easily access all the Foglight out-of-the-box reports from the Foglight Global View page by clicking on the Run A Report button. Once you click on the button, you will see a pop-up which lists all the available reports in the product. With Foglight for SQL Server Storage Report, you can check space usage for the entire instance in order to analyze storage user trends.
Let's review some of the reports. Here, we can see the top five database space chart as well as top five database lockspace charts. If you're looking to do storage capacity planning, you can leverage storage planning report with Foglight for SQL Server. This report shows you what is the current allocated size of all the data files in the specific instance that you selected. In addition, it shows you what is the prediction line, which is basically how much time it will take until the use size will be completely full and will reach to the allocated size.
In this case, Foglight estimated it will take 599 days until the storage will be completely full for the given selected instance. Foglight also enables to see enterprise level reports. These report show data not for a specific instance, but for your entire cross-platform database environments. In this case, we can see the instance inventory report as well as the availability summary report. Each one of those reports show data for all of your instances in the environment. This could be particularly useful when you're trying to see the entire picture of your database environment and not focus on a specific instance.
In-context reports are available in several dashboards in the product. For example, if you're investigating the workload in your environment via the SQL Performance dashboard, you can click on the View As PDF button. This will generate an in-context PDF report with all the data that you're currently viewing.
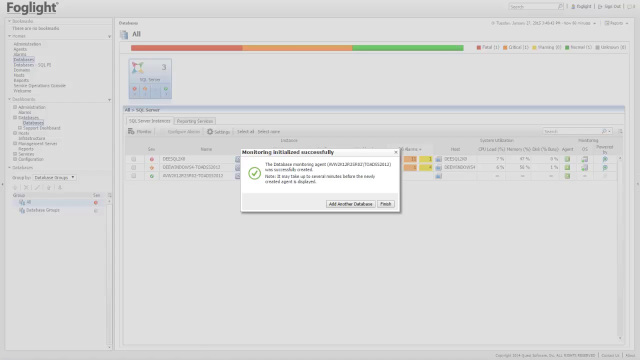
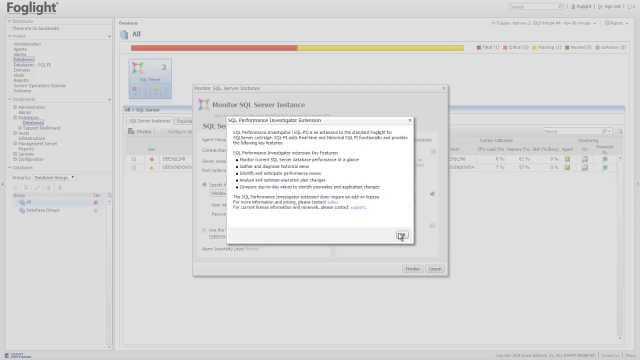
Deploying Foglight for SQL Server is an extremely straightforward process. To start monitoring, simply provide a SQL Server instance credentials and you're ready to go. Thank you very much for listening to this Foglight for SQL Server product overview. If you would like to learn more about the product, feel free to visit our website.
 17:32
17:32


